Blog · Homelab

Claude Isn't Just for Coding, it's an expert Sys Admin

I have spent months coding with Claude. Then one day I asked it to read a log file instead, and eight days later I was running a production sysadmin pipeline across two Raspberry Pi 5s with 1,190 tracked findings, a Teams card every morning, and a full 32-to-64-bit migration behind me.

By Michael Pierce · MDPSync · April 24, 2026

13 min read

The Wild Hair

I have been coding with Claude for months now. Mobile apps, websites, backend plumbing, the usual engineering work. One day on a whim I asked it to read a log file instead. The Pi sitting on my desk had been rotating syslog for weeks and I had not actually read any of it, because nobody reads syslog. You can tail it and watch text scroll past, but that is not reading. I grabbed the last 24 hours and pasted it into a session with a short prompt.

The First Prompt Here is the last 24 hours of /var/log/syslog from one of my Pis. Rank anything notable by how much it actually matters, tell me what is fine and why, and flag what needs action.

The response surprised me. Claude did more than summarize. It ranked findings by severity, called out two issues I had been walking past for weeks without noticing, and proposed remediation commands with the reasoning behind each one. That was the moment the frame shifted for me. Claude was not just a coding tool. It was a second set of eyes on operations, and it was better at reading my own logs than I was.

From One Log to a Pipeline

One log file became a habit. Then the habit became a pipeline. I wrote a small Python job that pulled the last 24 hours of Apache error logs from a vhost, sent them through the Anthropic API, and posted the ranked result to a Microsoft Teams channel as an adaptive card every morning at 06:00. A week later the pipeline had grown to cover every log I cared about, and the repo had a name: daily-briefing-pi.

Log sources

Each source gets its own classifier run, its own window, and its own noise filters tuned to what that log actually generates.

  • Apache error logs, scanned per vhost on a 24-hour window
  • Nginx error logs on the same daily cadence
  • Syslog and auth.log, swept weekly across the full 7 days
  • Access logs with path-pattern and status-code detection for recon and abuse
  • Process and kernel logs for OOM kills, segfaults, and tracebacks
  • Infra health checks for disk, load, memory, and SoC temperature

Classification, not just summarization

The daily channel runs on Haiku 4.5 because it is fast, cheap, and plenty smart for the apache-and-nginx grind. The weekly syslog and process-log jobs run on Sonnet 4.6 because the reasoning surface is bigger and I want the depth. Every finding comes back with a severity label (High, Medium, Low for the weekly channels, Important and Warning for the daily), a sample of the underlying events, and a suggested action written in enough detail that I can verify it before I run it.

Ranking is the feature that makes this practical. A flat list of errors from a week of logs is a firehose no sane person wants to drink from. Ranked by severity, it collapses into a scannable card with the high-stakes items at the top and the noise at the bottom where I can filter it out with a single rule.

Daily-briefing-pi Mac app showing ranked findings and remediation queue The Mac triage view. Ranked findings, active remediation sessions, and a path from card to fix without leaving the app.

The GUI

Teams cards were a good start but they are a read-only surface. I wanted something I could act inside. A couple of evenings later I had a SwiftUI Mac companion that reads the findings database on the NAS, lists open High and Medium items, and lets me suppress, resolve, or push an item back through the Anthropic API for a validation and fix pass. The approval gate stays in front of every destructive action, not because Claude cannot be trusted, but because I want to keep the operator in the loop on my own infrastructure.

The app does the things that would make a triage session annoying without it. Bulk suppress and resolve with a progress bar. An operator-curated suppress-rules engine that teaches the classifier what counts as noise on my network. Deep links from a Teams card straight to the matching finding. An in-app terminal backed by SwiftTerm for launching a remediation session against the right Pi without copy-pasting SSH aliases around.

Remediation flow with proposed fix and approval gate Remediation view. Verify the finding is still current, read the proposed fix, approve before anything runs.

Eight Days of Receipts

The easy version of this story is "I shipped a dozen fixes in a week." That is true, and it is also not very useful, because the whole point is the receipts. The findings database has been running since April 16. Here is what eight days of production looks like.

92%
Findings Actioned
1,190
Unique Findings
603K+
Events Deduped
0
Aged Out Untouched

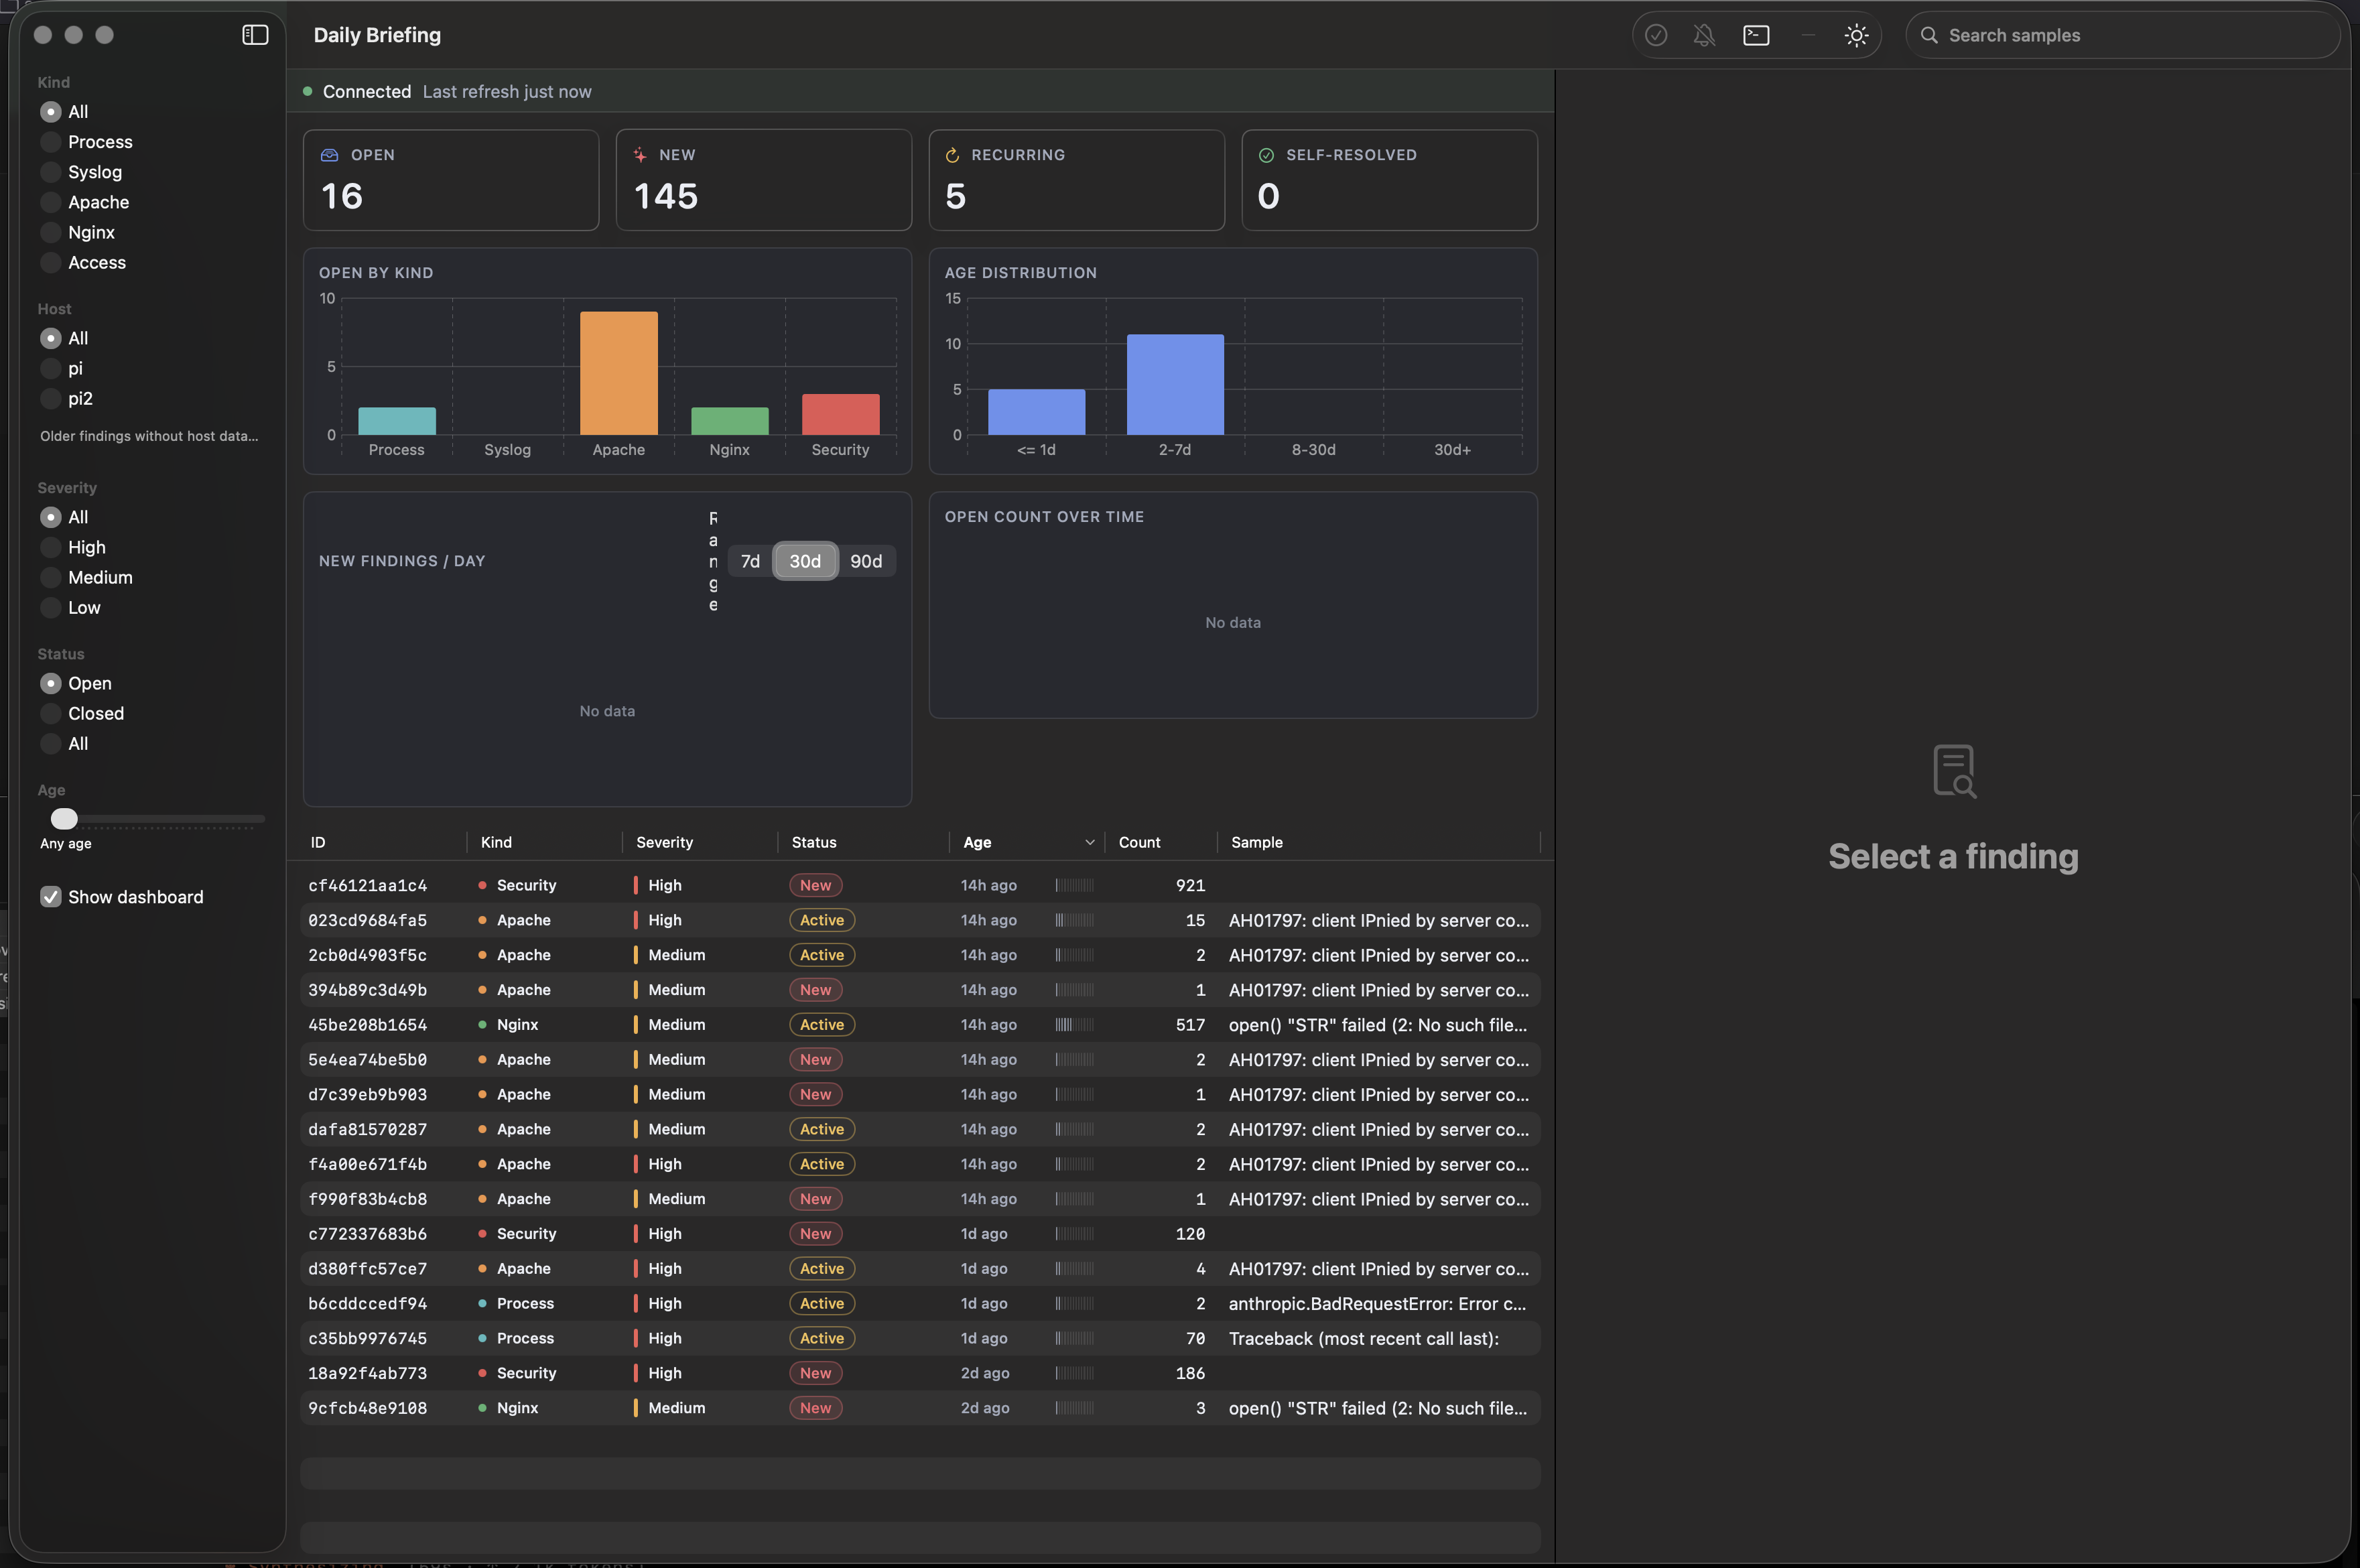
Where the work actually happened

Access logs dominate raw volume because public-facing web servers get scanned constantly, and almost all of that volume ends up suppressed as noise. Syslog is the cleanest channel because the classifier and I agree on what matters in it.

Log kind Findings Resolved Suppressed Open
access 760 214 463 83
syslog 277 250 27 0
process 82 11 69 2
apache 66 12 45 9
nginx 5 2 2 1
Syslog closed 250 of 277 findings with zero open. Access logs carry 64% of total volume, most of it recon traffic getting caught by suppress rules.

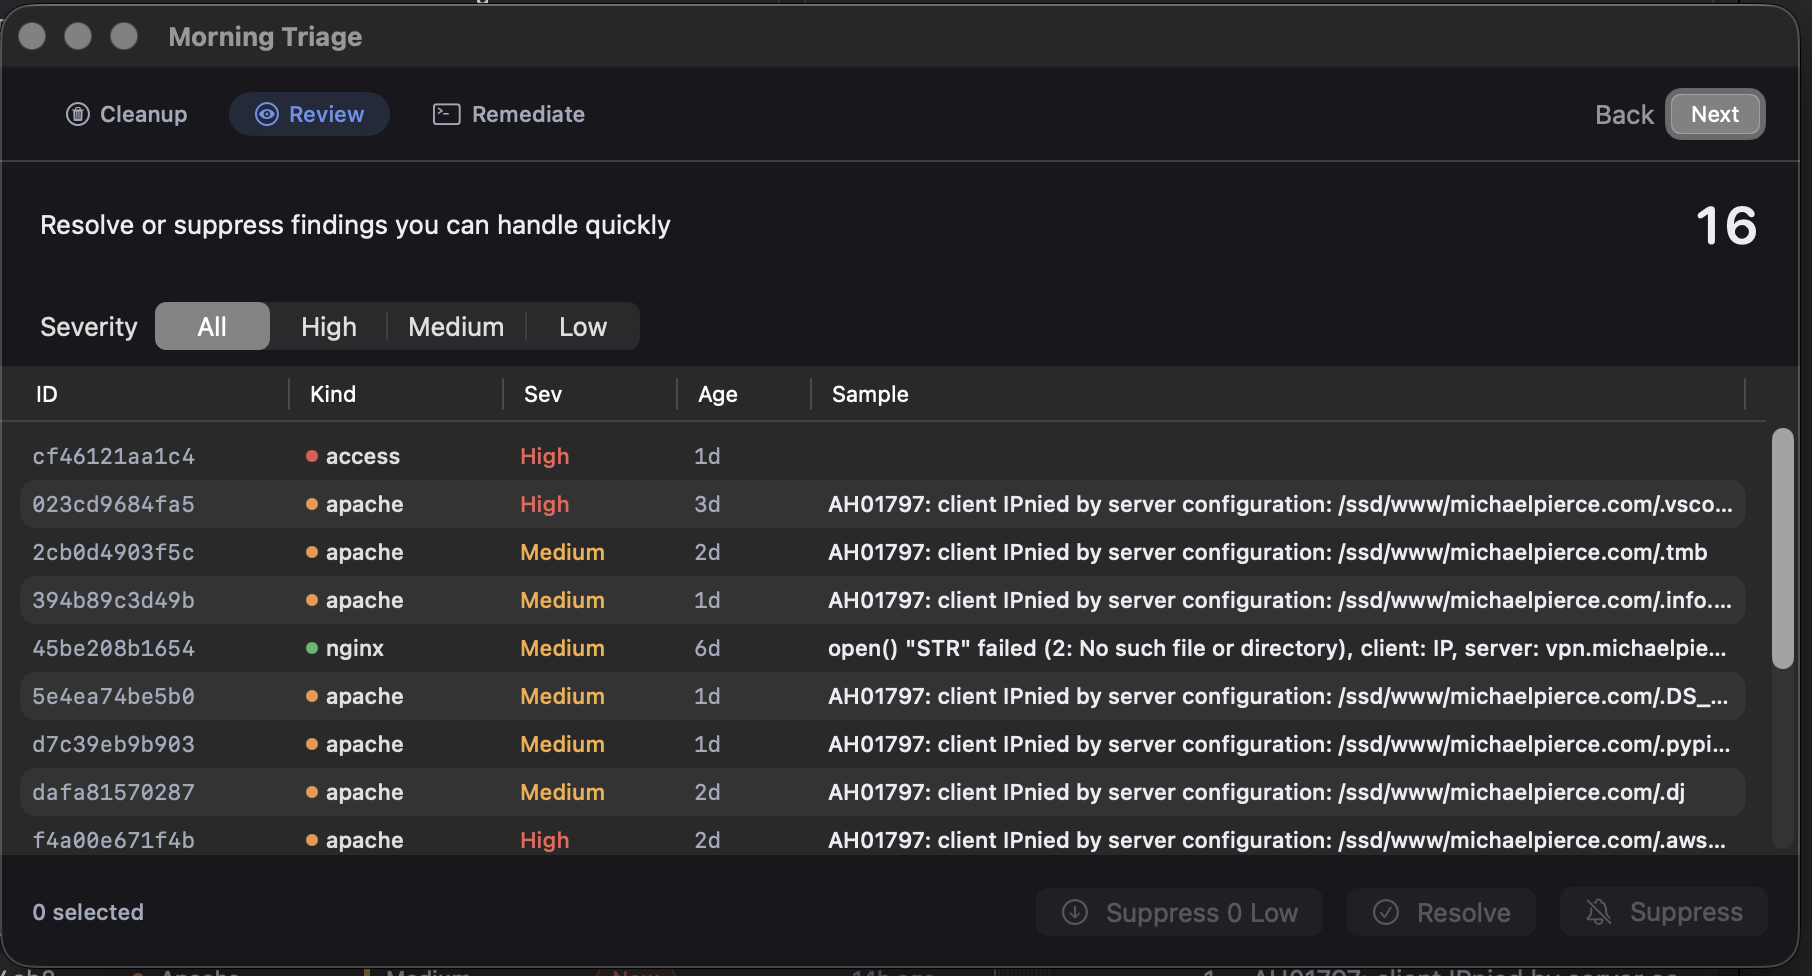
HIGH severity, up close

The classifier flagged 10 HIGH findings that turned out to be real and got fixed. It flagged another 7 that were scanner noise misclassified as high, which I suppressed once the pattern was obvious. That leaves 15 HIGHs still open, which I spent this morning reading. They cluster neatly into four groups, and writing them down here is the kind of thing I would have had no practical way to do a month ago.

Auth brute force. 8 findings, around 1,395 hits.

All auth_brute on pi2, spread across vhosts. The biggest single burst was 921 hits on adultwidescreenwallpapers.com on April 23. Recurring bursts landed on gulliblellama.com (three separate findings totaling 238 hits), therockcave.com (102), and a long tail of smaller 42-to-46-hit findings on April 24. Almost certainly the same bot sweeping every vhost in order. Next action is verifying the fail2ban apache-auth jail is active on pi2. If it is, the suppress rule writes itself, and the card stays clean without going blind to new patterns.

Apache config denials. 2 findings.

A .vscode path probe on michaelpierce.com, 20 hits over four days and still active. A .aws/credentials probe, two hits, textbook credential scraping. Apache is correctly returning 403 on both. The server is already doing the right thing, so these get suppressed with a note about why.

Process errors. 2 findings.

Anthropic API credit exhaustion inside therockcave/backfill.log, along with a 70-occurrence traceback from the same exhaustion. Both from April 21-22. The backfill has since completed, so these resolve with a note tying them to the credit event so the history carries the cause.

Access anomalies. 3 more.

An api_abuse burst on therockcave.com, 120 hits on April 22. A scanner_ua burst on haunts.michaelpierce.com, 186 hits on April 21. One-off events from days ago. These resolve as acknowledged.

None of this is glamorous. It is exactly the kind of long-tail triage that used to stay invisible inside syslog forever. Now it has a ticket, a history, and a next step that fits in a sentence.

Time to resolve

Syslog closes fastest because the signal is strong and the action is usually obvious. Apache and nginx take longer because they need a browser tab open and a few minutes of investigation before anything changes. That is not a bug in the process. That is the process working.

Kind Avg Min Max
syslog 8.9h 4h 9h
access 13.2h 7h 16h
process 47.3h 7h 53h
apache 68.8h 5h 98h
nginx 71.5h 3h 140h

The suppress-rule payoff

Four operator-curated suppress rules are blocking 260 findings before they ever reach the classifier. Two rules do most of the work. One is recon_path combined with a 404 response, catching 115 hits of scanner probing. The other is php_probe combined with a 404 response, catching 145 hits of the same. Recon and PHP probe traffic accounts for 695 of 760 access findings, and the suppress engine handles 260 of those before anything reaches a Teams card or an API call, which is the behavior I want.

Who actually closes the findings

Of 1,167 resolution actions, the Mac app drove 840 of them. A bulk data-repair pass accounts for another 253. I closed 60 by hand. Operator-mode automation handled 14. Seven Mac-app remediation sessions left full transcripts behind, and the longest one ran roughly 12 minutes on a process-log finding, producing about 50KB of reasoning before landing on a fix.

Ramp-up timeline

April 16 through April 18 was bootstrap. Forty-eight findings, mostly syslog and process logs. April 19 through April 23 was the big ramp once the access-log briefing went live, and 1,105 findings landed in five days. April 24 is already settling to 37 new findings for the day, which tells me the suppress rules and the initial triage pass are converging on a steady state.

The Bottom Line 92% action rate, sub-day mean-time-to-resolve on syslog, four suppress rules blocking 260 findings of scanner noise at the door, ten HIGH findings actually fixed, and fifteen open HIGHs with a next action written against each one.

The Migration Story

Somewhere in the second week of this I noticed something that I had apparently been ignoring for years. My Pis were running a 32-bit userland on a 64-bit kernel. Technically fine. Practically fine. But if you have ever had a moment of OCPD about a system that is quietly wrong in a way nobody else would notice, you know exactly how that sat with me. I asked Claude what a migration would look like.

The first response was a polite version of "probably not worth it." Too many moving parts. Too many configs. Easier to live with. I disagreed. The reason to do the migration was not performance. It was that I did not want to run a system that was wrong on purpose, and the only way to stop running one was to not run one. So I wrote a migration prompt and I was explicit about the shape of the work.

The Migration Prompt Walk me through migrating this Pi 5 from a 32-bit Raspberry Pi OS userland on a 64-bit kernel to a full arm64 userland without hand-rebuilding every service from scratch. Inventory everything installed, every cron, every Docker container, every config under /etc and /ssd, every systemd unit I have customized, and every vhost. Propose a staged plan with a rollback path at each step. I will approve each phase before you execute, and I want a summary of what changed after each phase so I can keep a clear picture of state.

The first Pi took about two hours end to end, most of it data movement. The second Pi, the more complicated one with the entire web stack and the databases, took roughly the same time because the first run produced a reusable playbook and a known list of gotchas. Both machines are now running a full 64-bit userland with every service verified against its pre-migration baseline.

The lesson is not that Claude can do migrations. The lesson is that "probably not worth it" was a starting offer, not a verdict. The back-and-forth was the work, and the work turned a two-week project into an afternoon twice over.

What This Looks Like for You

If you run a homelab or a small fleet of servers that nobody else is paid to look at, you have the same problem I had. Logs rotate. Nobody reads them. Issues settle into the ground noise. The way out of that is not heroic monitoring infrastructure. The way out is starting one conversation.

Start with one log file and one prompt. Ask Claude to rank findings by severity rather than just list them, because the rank is the filter you will rely on every day after that. Ask for a remediation plan before any command runs, and approve the plan one step at a time. Grow the pipeline one log source at a time, because the architecture reveals itself after the first source is working and you can see what you wish it did differently. Keep a human on the approval path for anything destructive, because that is not a limitation of the system. That is the feature.

Nothing in this post required anything exotic. A Python script, a cron entry, an Anthropic API key, a Teams webhook, and a few evenings of reading what came back. The leverage was not in the tooling. It was in letting a model that reads carefully do the reading for me, and keeping my attention on the decisions at the top of the card instead of the thousand lines of noise at the bottom.

Want this running on your infrastructure?

daily-briefing-pi is a private project, but the pattern travels. If you want a ranked, approval-gated log-triage pipeline on your own boxes, start a conversation.

← Back to Showcase